See where the market agrees.

The levels you already draw — scored and watched in real time. Where independent methods historically lined up, price reacted. Backtested — measured from what already happened, not a guess about what's next. One morning scan, levels locked, your call made in the first 45 minutes.

Zones lock at the close and never move — no repainting. No buy/sell signals; you decide.

Get early access
Yes No Levels Pro — $99/mo · 30-day money-back
The thing nobody else has
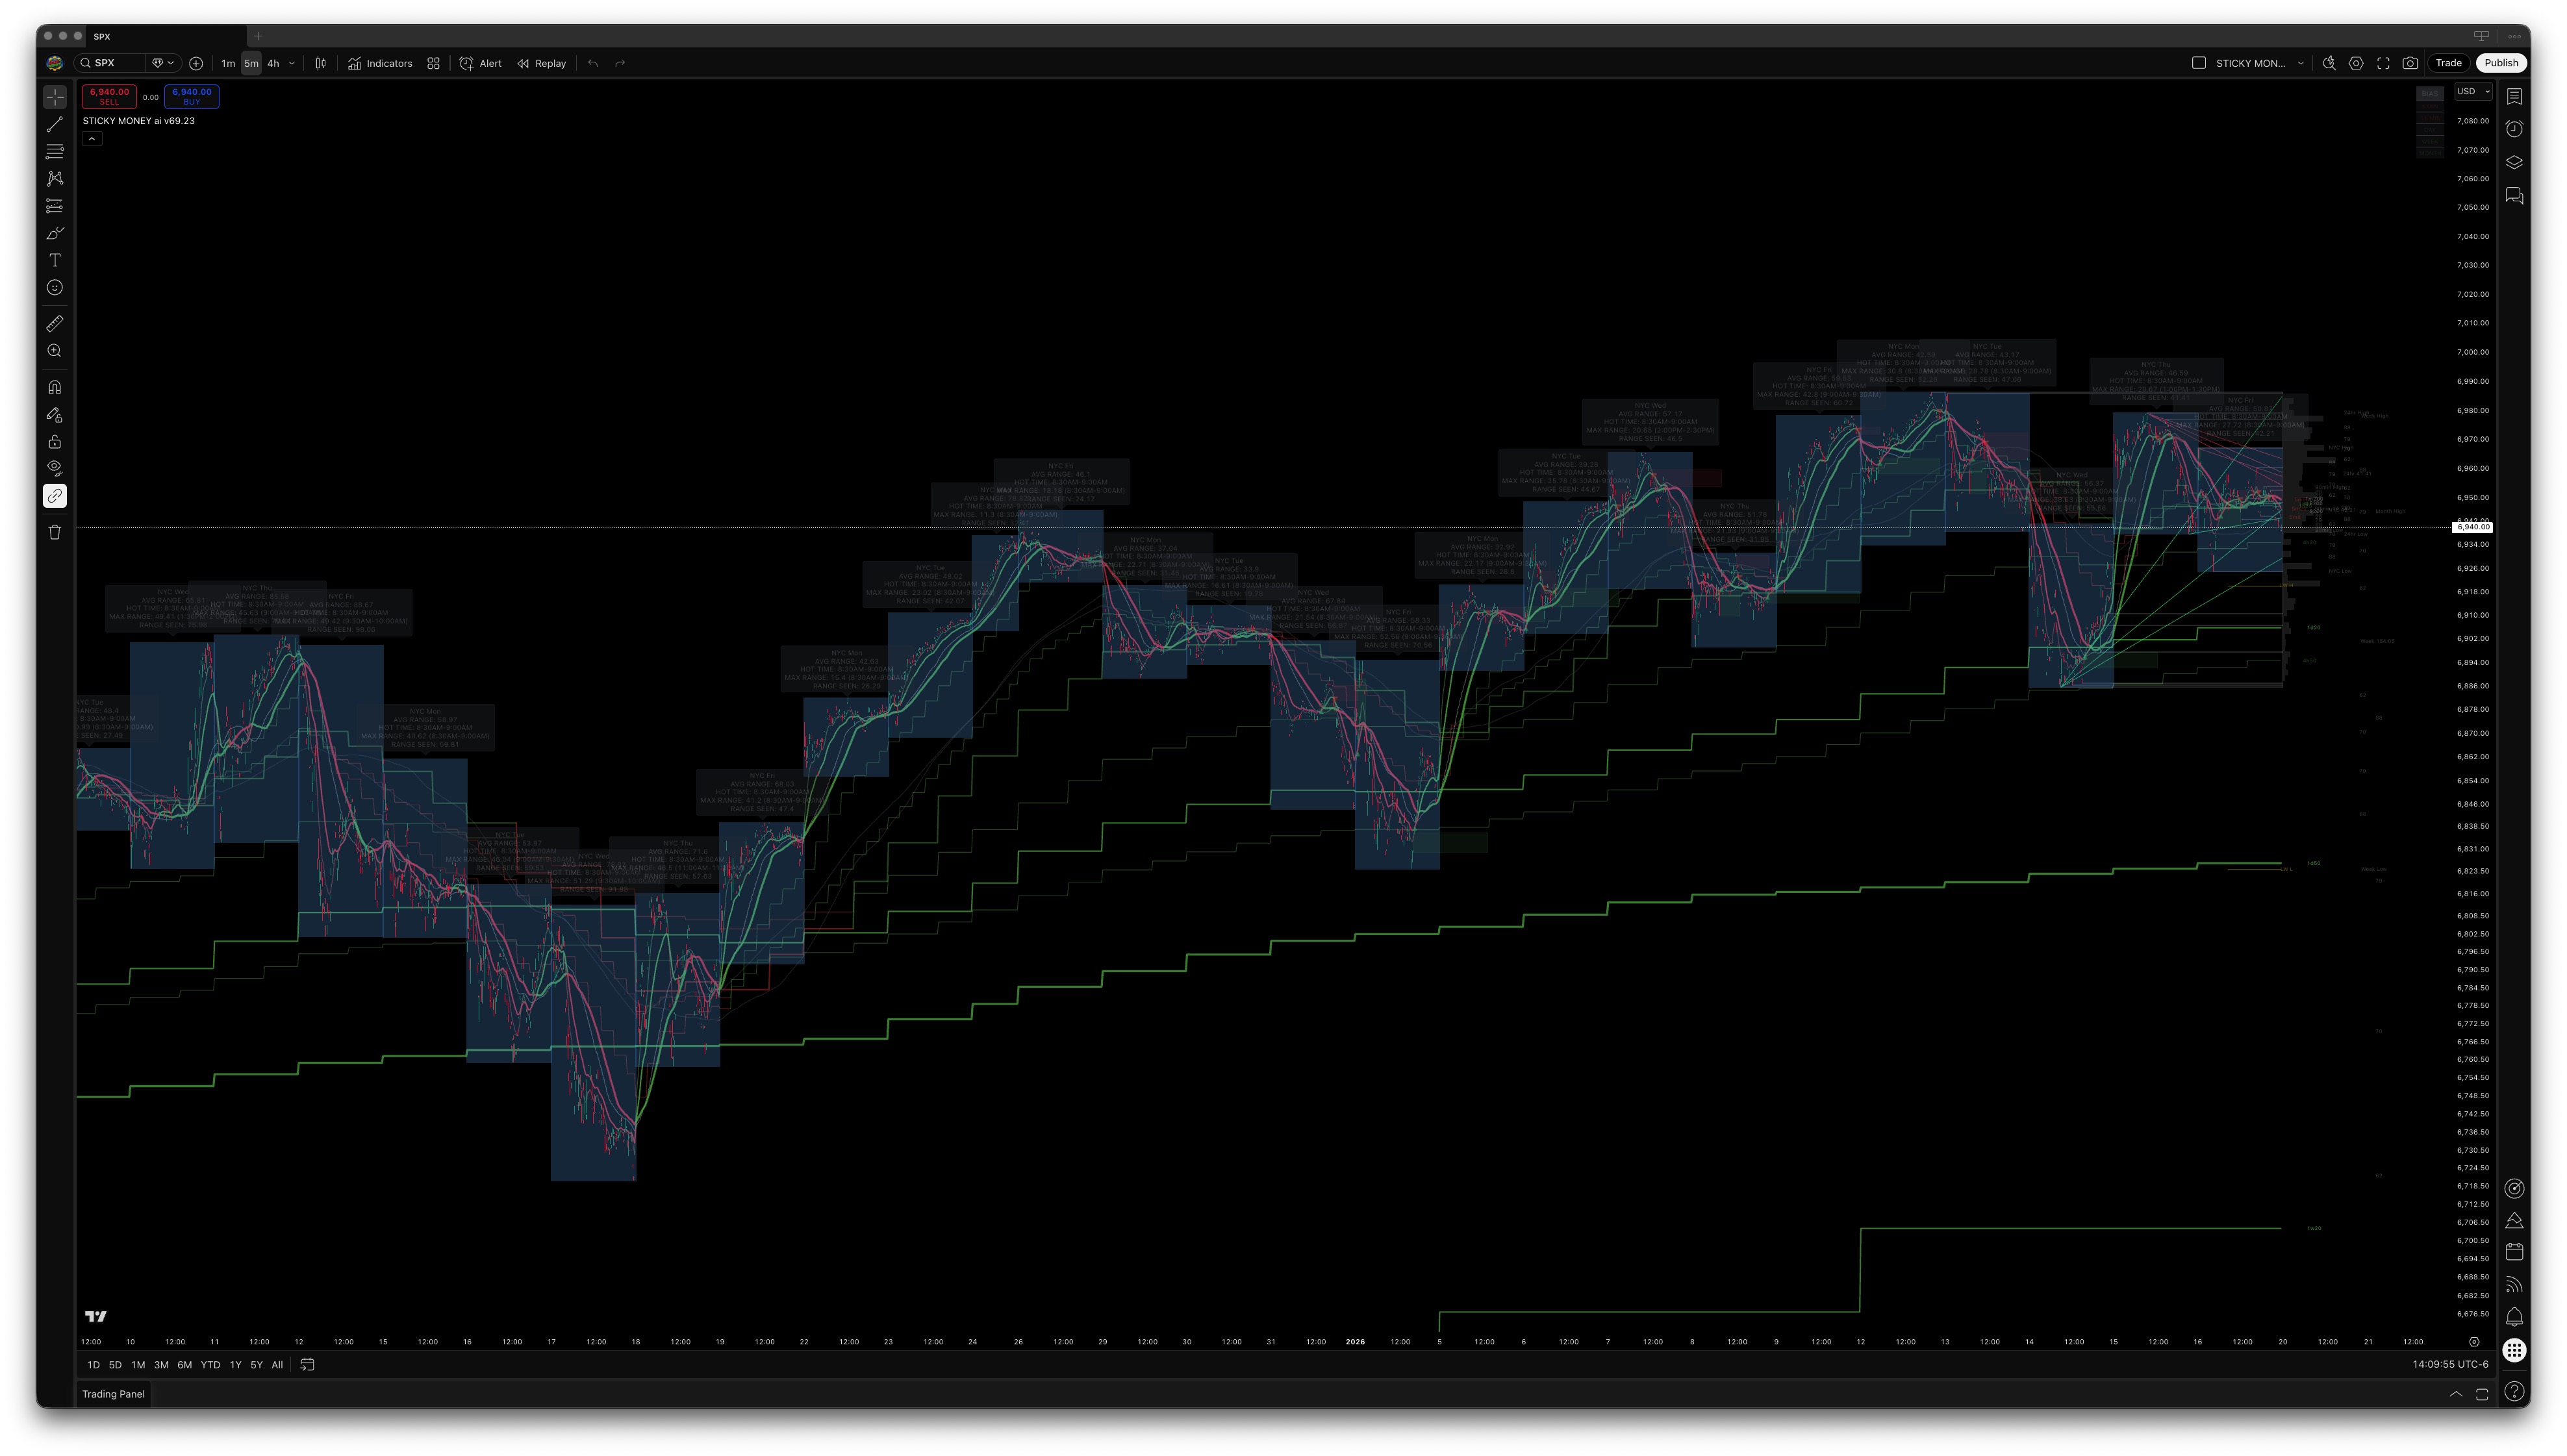
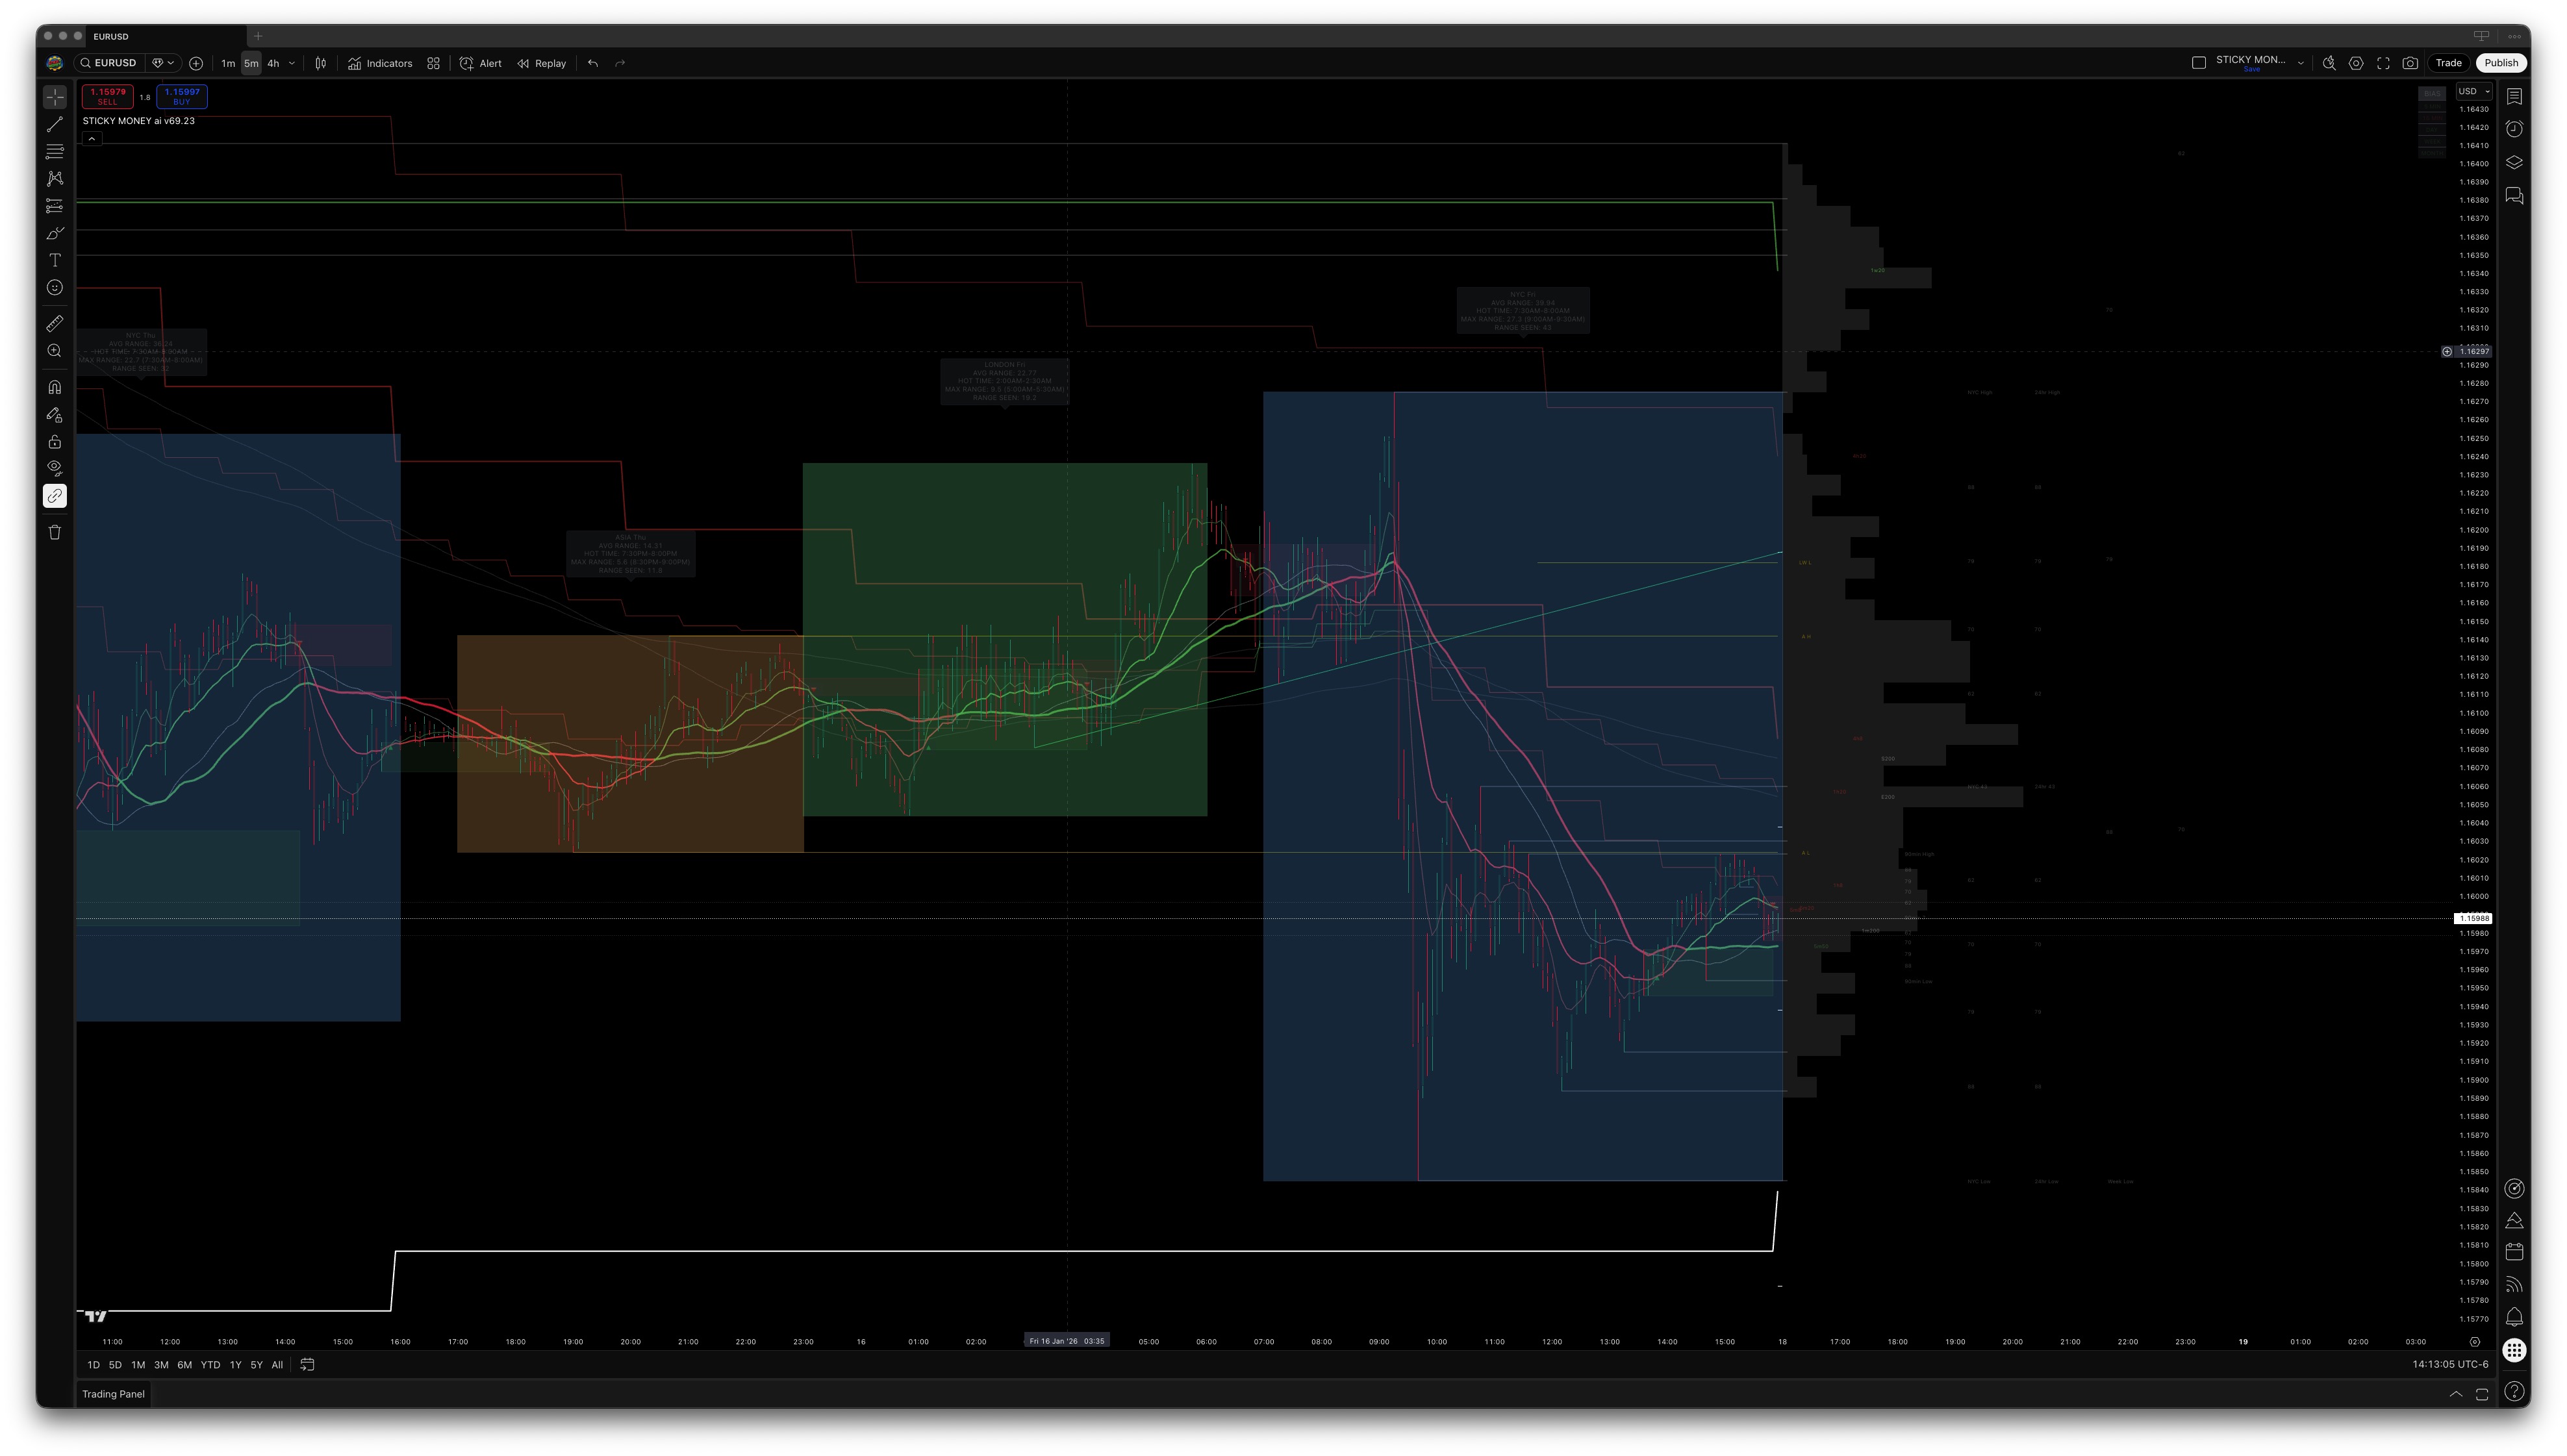
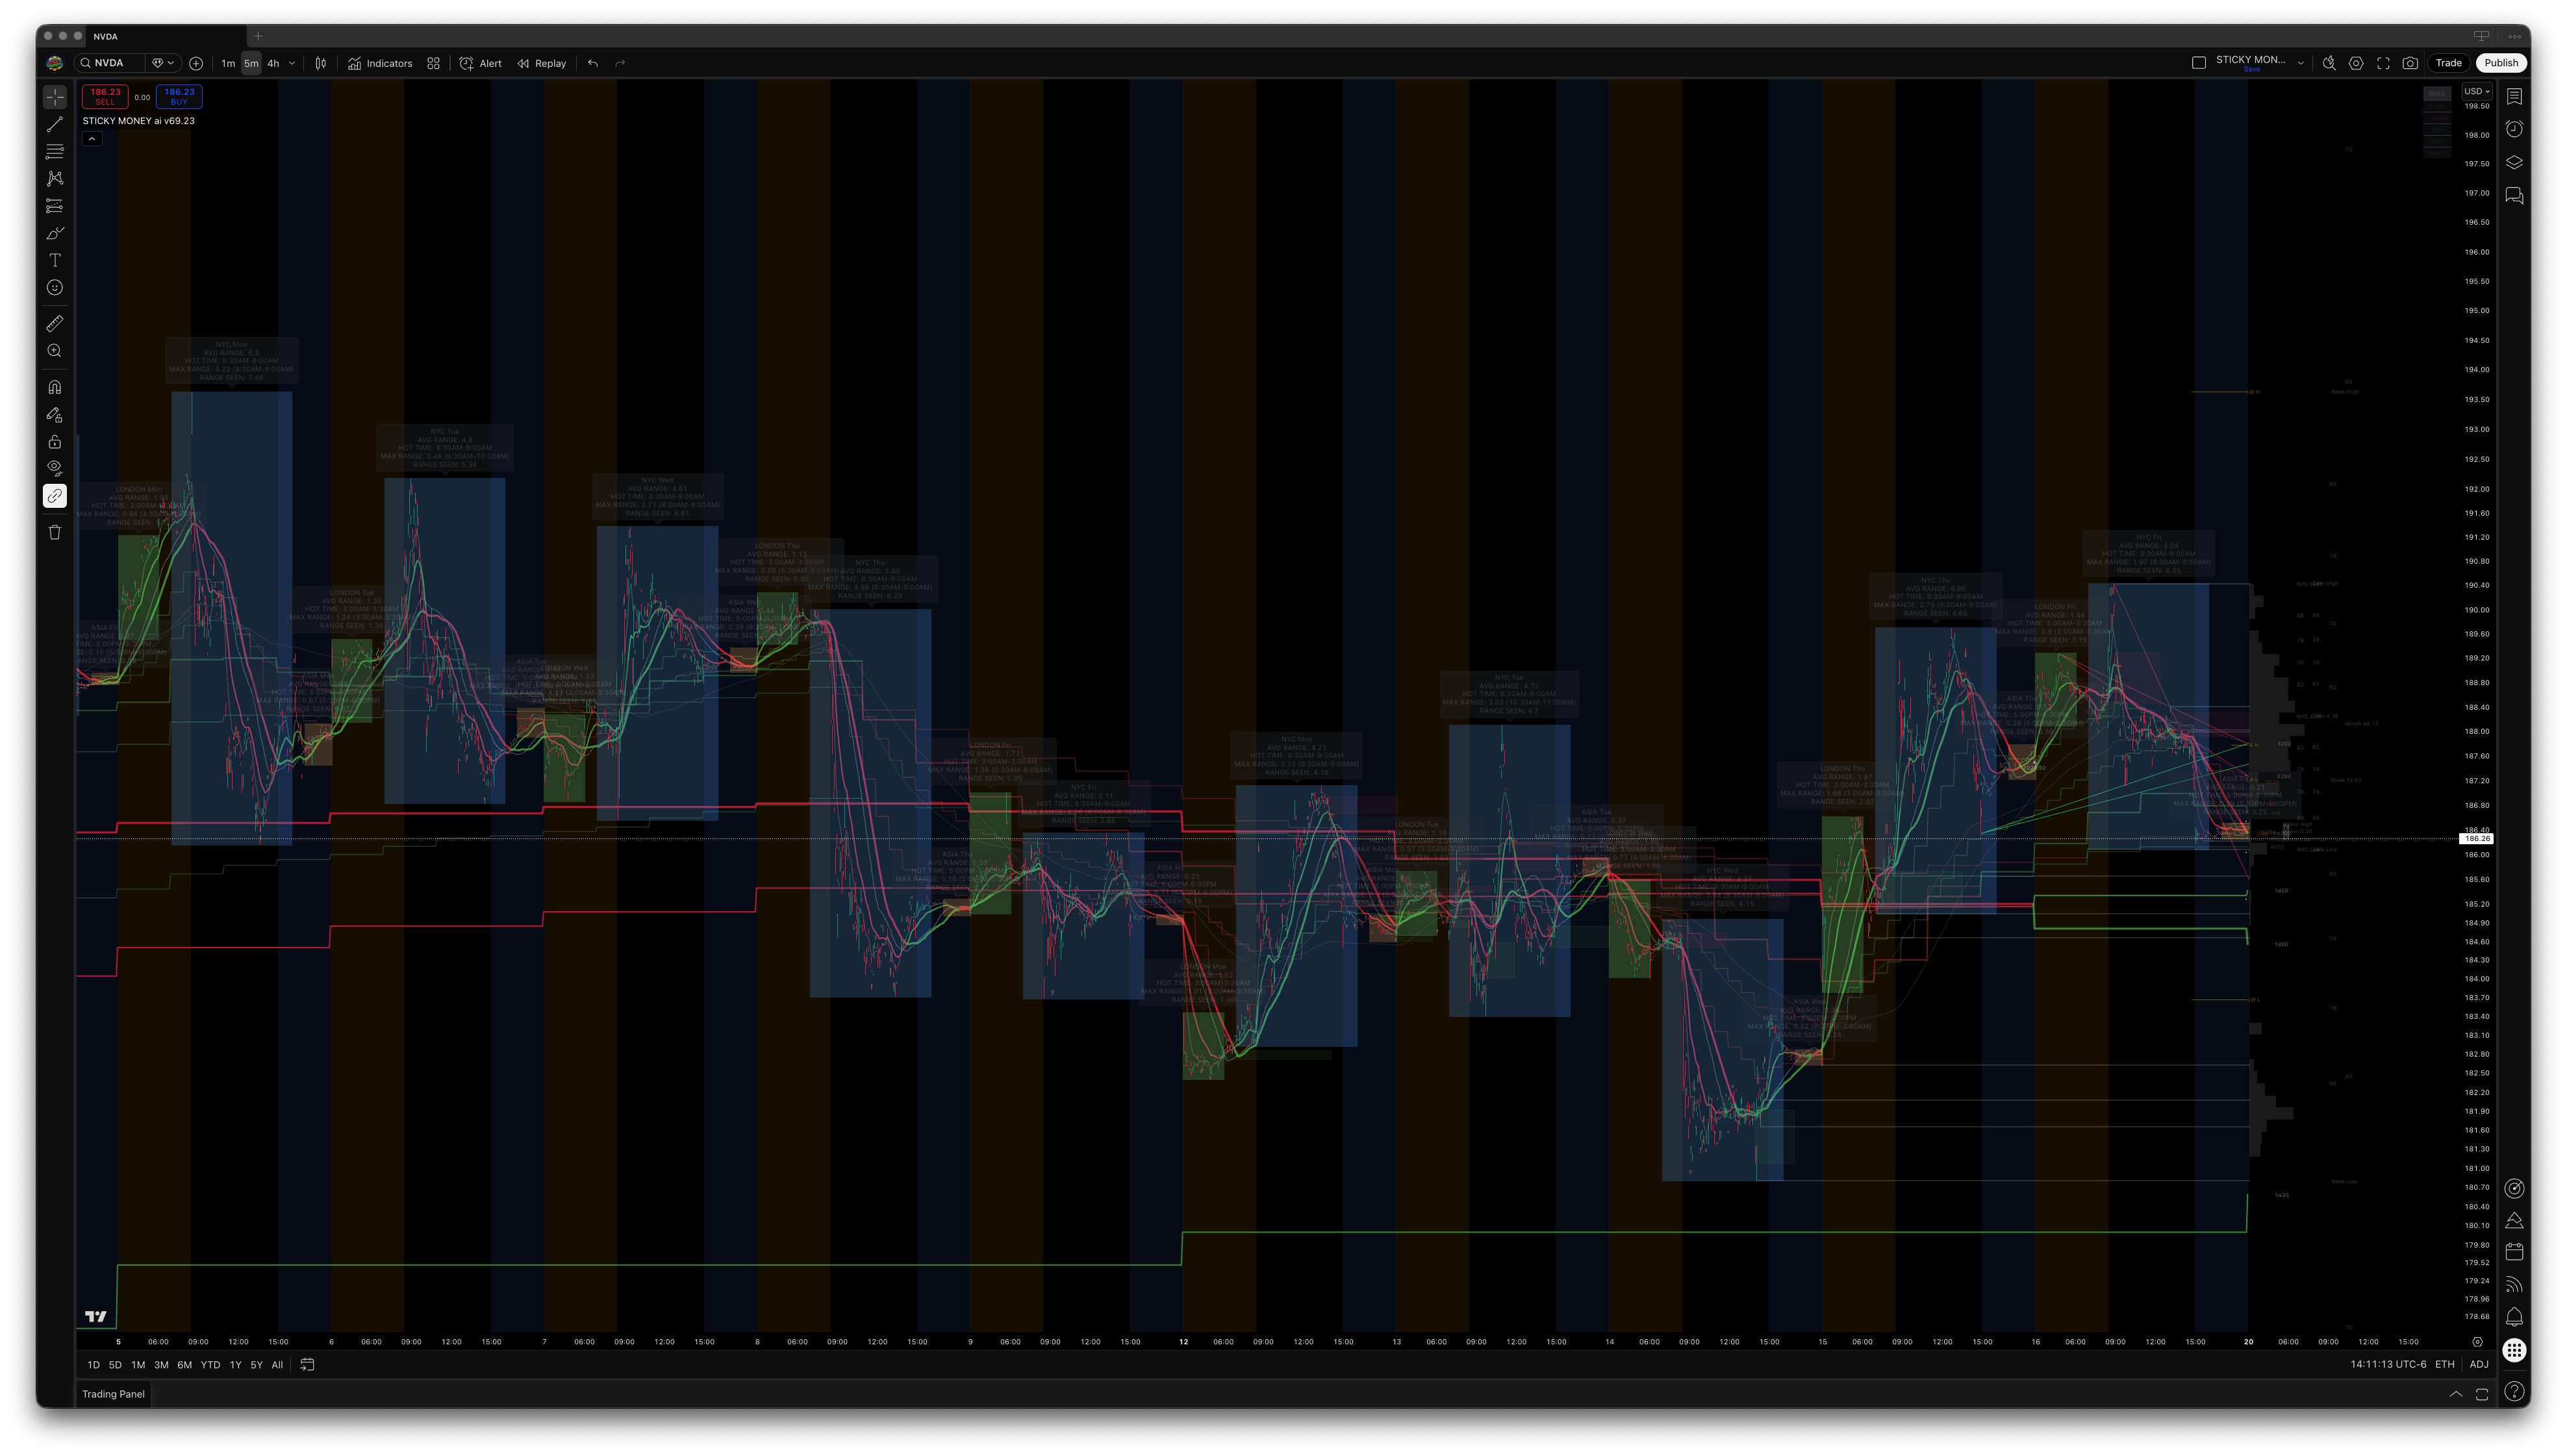
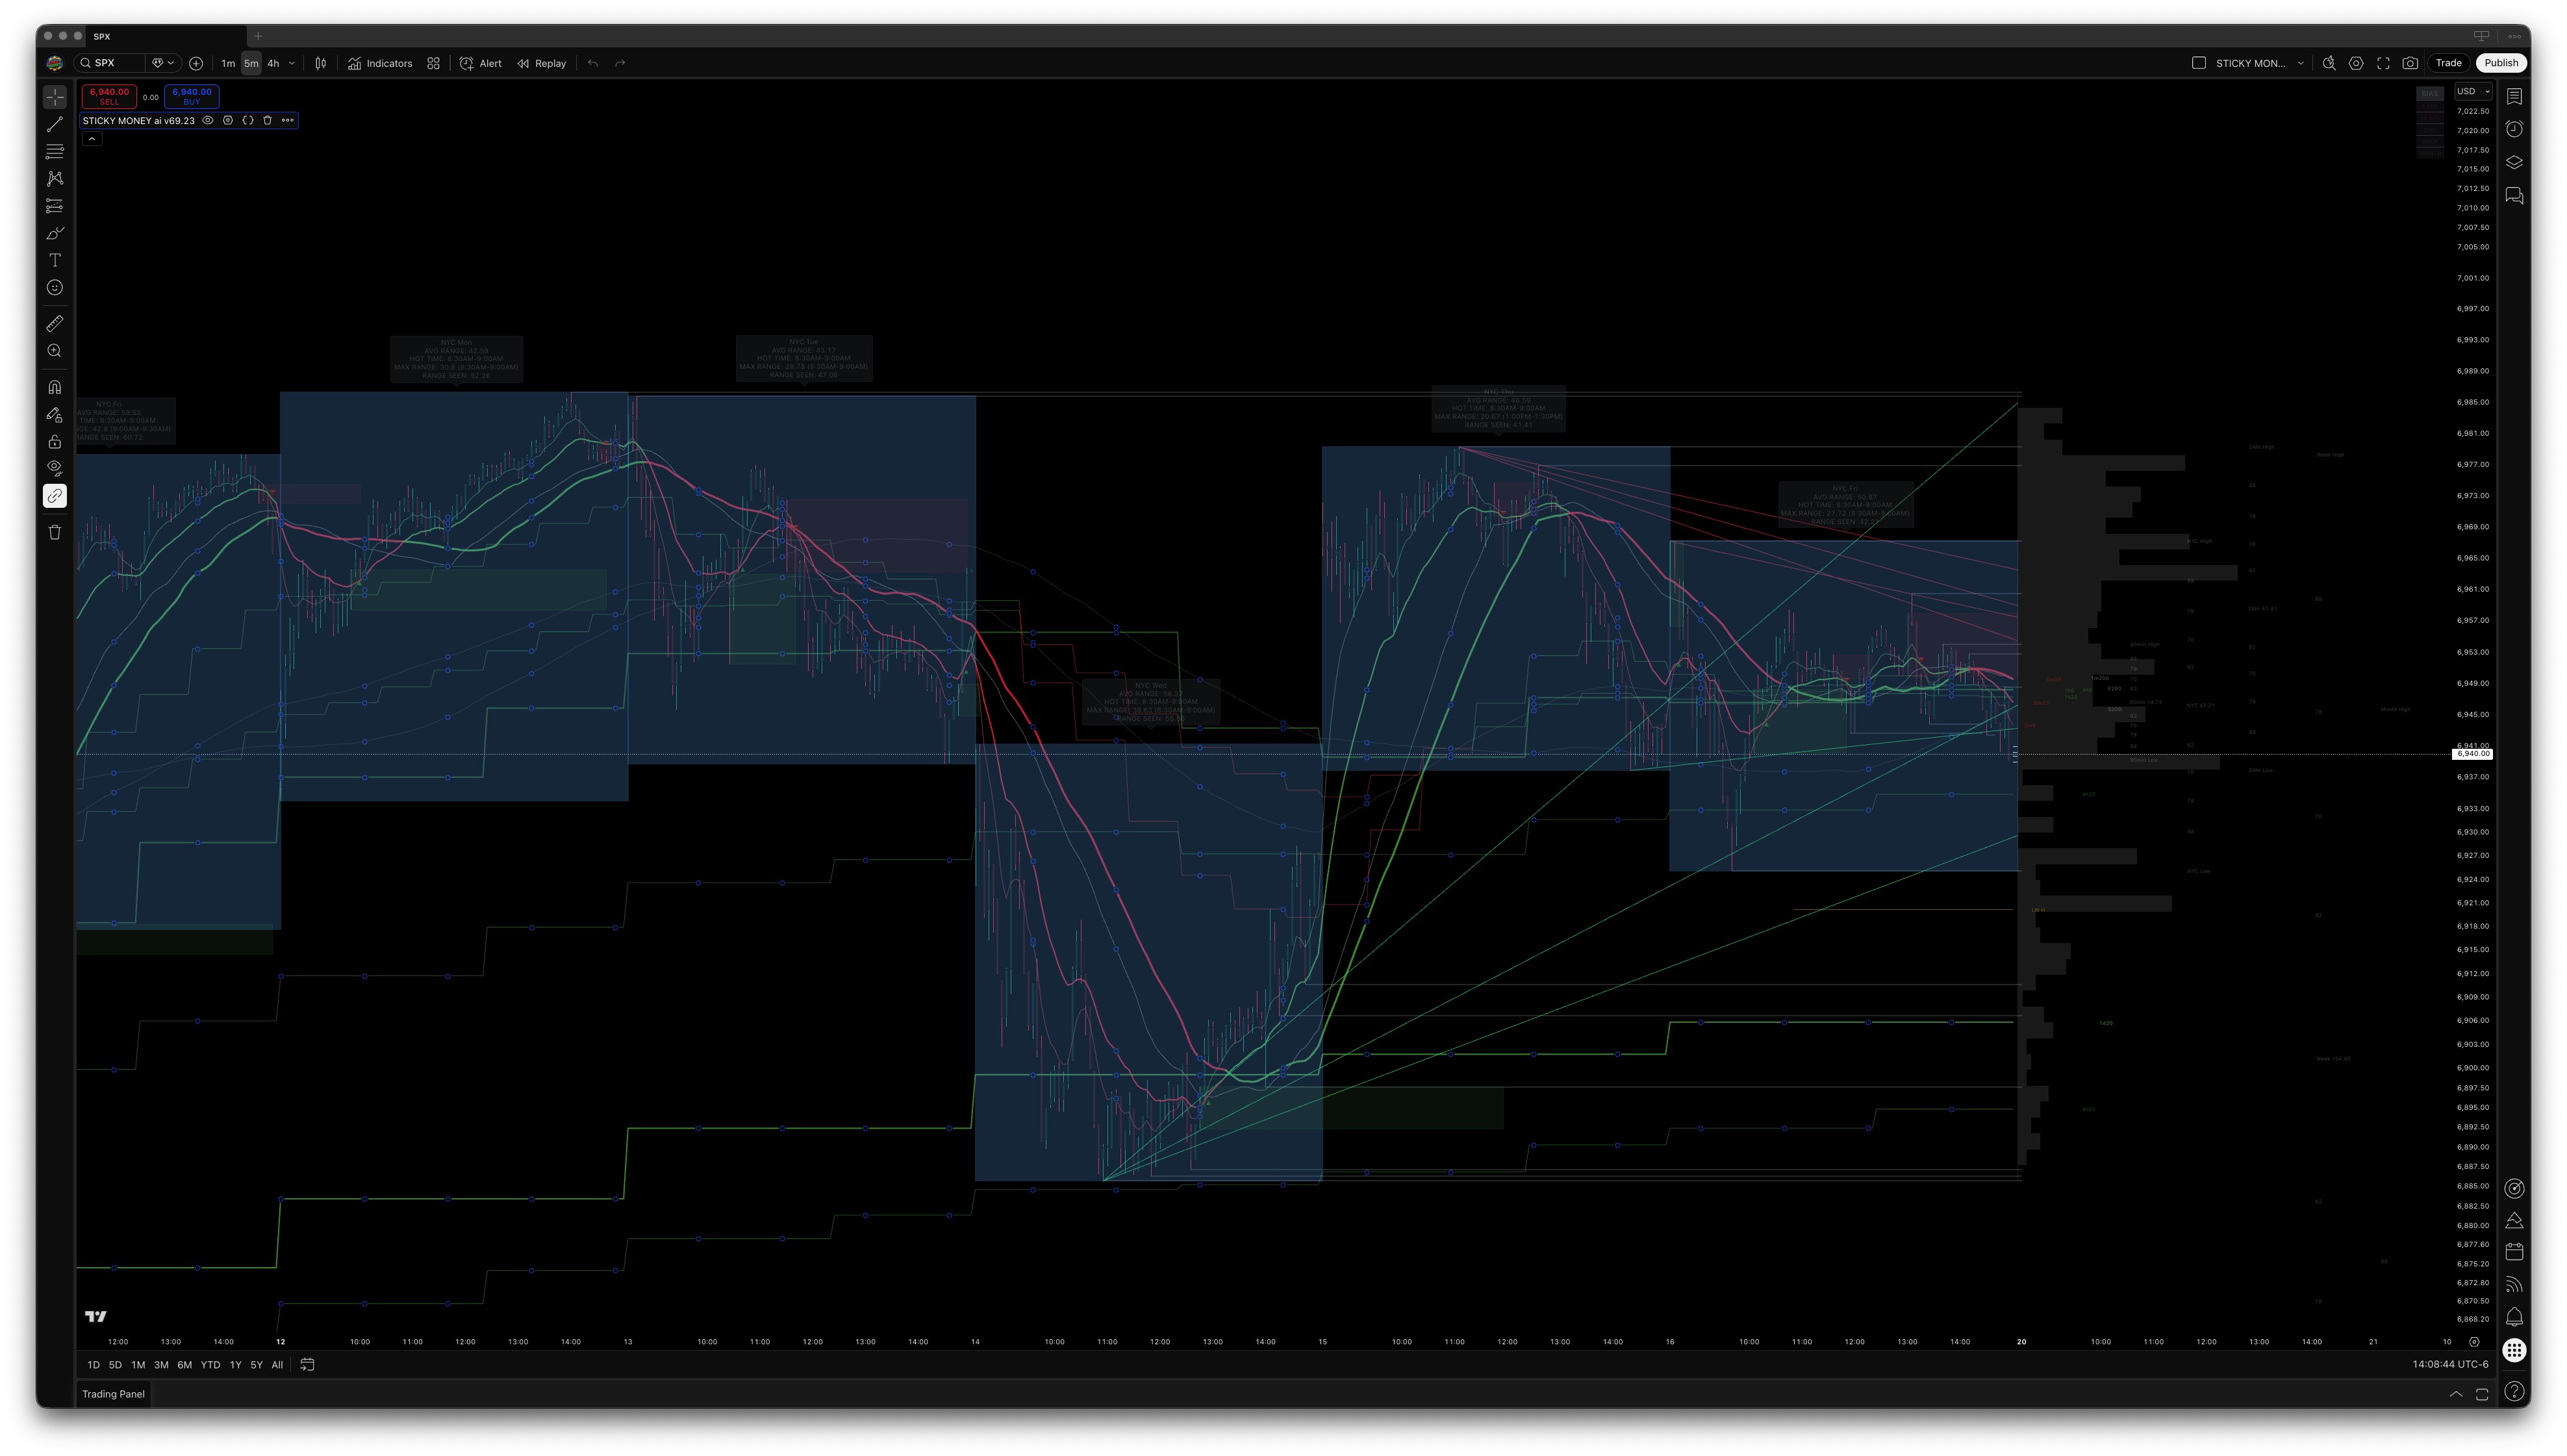
Agreement Zones

Where independent methods line up at the same price, a zone. Where they historically lined up, price tended to react.

Agreement zones — colored boxes showing where independent methods lined up at each price

Where levels agree

When several independent methods land at the same price, the zone lights up. The more that line up, the stronger it's drawn.

Historical zones persist across sessions. Scroll back and see where levels aligned with past price reactions.

The more independent methods that line up at a price, the stronger the zone — and the brighter it's drawn. How those methods are combined and weighted is proprietary; what you see is the result — the levels that matter, ranked, on one chart. More on the approach →
How it works

The levels that move price — all on one chart

Levels stacking up on SPX

Where levels stack up

When several independent methods land at the same price, that cluster lights up as an agreement zone — the more that line up, the stronger it's drawn.

Where trading actually happened

Aggregated volume mapped to price. Price slows at thick zones and moves fast through thin ones. You see which is which before you enter.

Where volume traded, on EURUSD
Session telemetry on NVDA

When sessions move

Each session tracks its own history. You see the 30-minute window where volatility peaks, the average daily range, and the largest move with timestamps. Structure, not noise.

What's on your chart

Everything in one overlay

Toggle what you need. Everything else stays out of the way.

Agreement Zones

The more independent methods that line up at a price, the stronger the zone — and the brighter it's drawn. Zones persist across sessions. How they're combined and weighted is proprietary.

Dynamic levels, every timeframe

Projected from 1-minute through monthly, color-coded by timeframe so you see which agree on direction and which don't.

Session Structure

London, New York, Asian. Per-day average range, 30-minute hot window, largest intraday move with timestamps.

Where volume traded

Aggregated volume mapped at price, not time. Where the most trading actually happened.

Retracement zones

Levels price keeps returning to — from 90-minute, daily, weekly, and monthly ranges.

Bias Dashboard

Are timeframes pointing the same way? Check before you lay your money on the table.

Structure that held

Swing points that held — extending as lines until price breaks through.

Trendlines

Drawn automatically from confirmed pivots. Only the strongest lines appear.

Volatility squeeze

Shows when sessions are running tight vs. typical range — tight range plus declining volume. Structural context, not a forward signal of expansion. Methodology →

When a level reacts

Plain-English alerts, the moment it happens

When price reaches a zone, you get a three-line alert: what set up, what to watch, and what the backtested record says followed. No jargon, no directive — you decide.

Five patterns, named in plain language

First-hour break — price broke the first-hour high or low.

Tight first hour — an unusually tight opening range.

Sweep and reclaim — swept a session high or low, then closed back inside.

Dip and snap — dipped below the low, then snapped back.

Break and retest — broke through, then came back to test the level.

Every rate is backtested and carries the number of cases it was measured on. The alert flags what to watch — never what to do.
EXAMPLE ALERT

EURUSD broke the first-hour high (1.1654) on a strong move into the New York session. Watch for a hold above 1.1654 over the next 30 min as confirmation. Backtested: 73% of 89 similar breaks reached 1.1675 within the session, median 42 min; a close back below 1.1645 cancelled the break.

Included with Pro

More than an indicator

The chart is where it starts. Your subscription also includes the record and the weekly read.

The outcome dashboard

Once you're in, every alerted level is tracked against what price actually did — hit, miss, or pending — over a rolling 90 days, sliceable by asset class, timeframe, and pattern. Your record, in the open, misses included.

The weekly digest

The part no competitor combines: once a week, the full ticker set read through three lenses few hold at once — what the zones did (backtested, with case counts), what prediction markets had been pricing on the events tied to those tickers, and, when a real catalyst warrants it, the sector context behind the move. A research desk's note, in plain English, broadcast the same to every subscriber.

21
of 40 security calls used
7
timeframes
Live
narrated alerts
0
buy/sell signals
Pine v6
TradingView
All
asset classes

$99/mo

The indicator, plain-English alerts when levels react, an outcome dashboard you can audit, and a weekly three-lens digest. 30-day money-back guarantee.

Subscribe — $99/mo